Content:
2.6 Data quality of article master
2.9 Visualization and saving of data sources
1. Introduction
The Qlik Sense Business Intelligence Tool is a modern software that provides a comprehensive visual representation of its data sources. The user-friendly application allows people of any skill level to use the tool efficiently.
If you want to access a specific chapter, simply click on the name of the chapter and you will be taken directly to that section.
If you have any questions or comments, please feel free to send us an email to support@wbv-distribution.de .
2 . Navigating the BI Tool
Individual processes can be displayed and tracked via the BI tool.
The menu is displayed in tiles, one tile reflects one process. Clicking on one of the tiles takes you to an overview of the selected process. When a tile is selected the language can be changed.
Notice: In the following examples sensitive data has been censored, therefore some fields appear empty although they are filled.
The BI tool includes the processes goods receipt, returns, delivery reliability, article stock with history, data quality of the orders and the article master as well as an annual comparison.

After access, each area is first displayed in a current overview, which is represented by the period indicated by the upper bar highlighted in red.
Mainly all areas of the BI tool can be navigated with the menu on the right. There you have the possibility to select and display data by month and year. It is possible to display several months/years at once.

If you want to view data for individual days, use the bar chart in the lower half of the screen. Here, all individual days of the entered period are listed and clickable. Clicking on a bar will take you to the day view for that day.

2.1 Incoming goods

Unfullfilled goods receipts or positions can be viewed immediately.
The ordered quantities and the quantities actually shipped can be compared and discrepancies can quickly be identified.
By clicking on an order number, an individual view allows access to the data for a goods receipt of a specific date:

2.2 Returns
Returns are processed daily and should be visible in the Qlik dashboard within 24 hours.
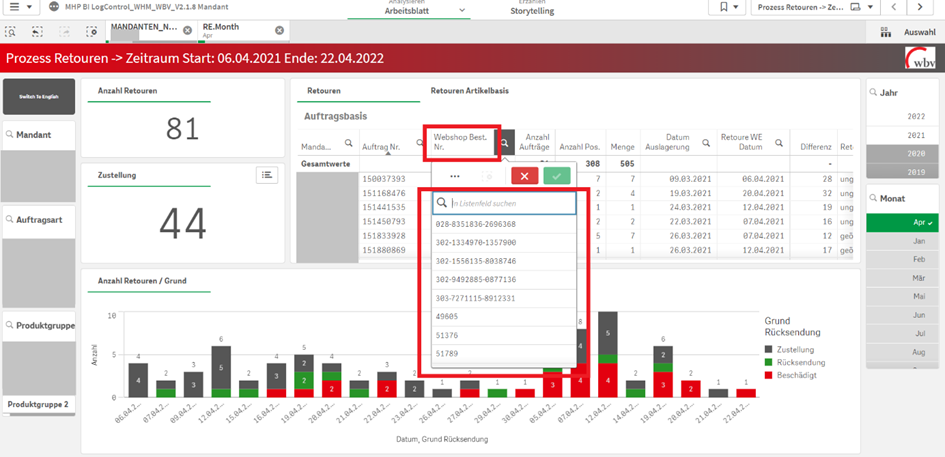
Selecting the "Process Returns" tile in the dashboard will take you to an overview of returns.

Notice: Only the returns for the period shown in the red bar are displayed. This should be considered if you are looking for certain return.
On the left, the enlarged number "81" shows the total number of returns for the selected period. Below that, the number 44 represents the returns that were returned due to problems with delivery. These are most often mistakes in the customer's address.
The following data is displayed :
- date of return
- reason for return
- What was returned? -> This parameter will be discussed in the chapter of the individual view
The bar chart is divided into different colors:
Gray = Problem with delivery (e.g., recipient cannot be determined, not picked up, or an incorrect address).
Green = Returned by the recipient
Red = Transport damage

By clicking on a bar, a single day can be displayed.
Clicking on the order number or webshop order number takes you to the view of a single return, as shown in the screenshot below.

The single view of a return shows a number of data, which are important for the handling of orders regarding refunds, complaints and reshipment, this data includes:
order number
webshop order number (marked red)
number of orders
number of items total / single order
quantity of returned items total / per order
date of removal from stock (dispatch)
return Date: Date of receipt of the return
difference
return status
reason for return
Another feature of the returns dashboard is the returns item base view (highlighted in red below), which allows you to view all individual returned items, as well as the condition of each item.

By scrolling to the right, you can view the status of the items.

2.3 Delivery performance
Using the delivery reliability process, the percentage value of the delivery reliability can be determined quickly and clearly. On the left side of the view, the delivery performance is displayed graphically:

The circle diagram is divided by color. If the gray pointer is within the green highlighted part of the diagram, the targeted delivery performance is fulfilled.
It may be interesting to know why 100% was not reached on certain days.To do this, click on the "SLA" tab (red arrow) above the bar chart.

If you select the red legend, the orders that have not fulfilled the SLA are displayed.

2.4 Item stock with history
The item stock with history area allows item stocks to be tracked in detail over the entire period.

Below this, you can choose between three views. This is done using the tabs "end of day stock", "end of the week stock" and "end of month stock".
When you click on one of the tabs, the respective stocks for the specified period are displayed in the diagram below.

By clicking on the article number, you can also filter for a specific article:

In the table "Current stock" you can see information about the article stock, the available stock, the storage location, the best before date of the article, as well as the batch number. (It can be enlarged using the arrows in the right corner).

2.5 Data qualitiy of orders
In this overview, you can clearly see whether and how much data is missing for orders. These relate to the addresses of the customers. If certain errors occur frequently, the causes, such as a problem with the address form in the online store, can be found quickly.

If data is missing, the field is highlighted in red and the number of orders for which this data is missing is displayed. By clicking on the field you will get to the order overview:

2.6 Data quality of article master
This overview is similar to the previous one.
The article data include:
- weight
- dimensions
- deletion indicator
- designation
- product group
- customs data
2.7 Annual values
In the last overview shows the previous overviews in year-on-year comparison.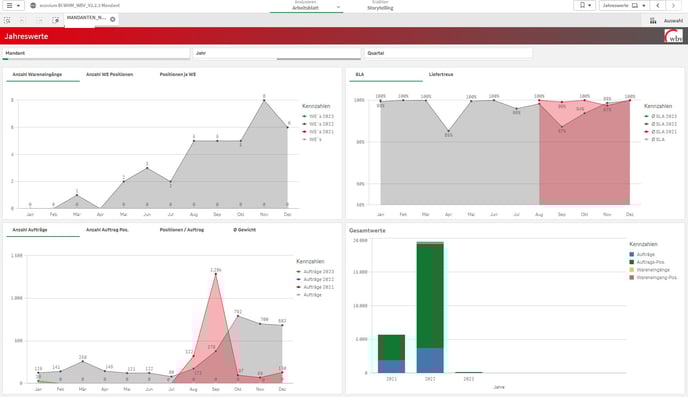
2.8. Order Status
The last overview gives information about the submitted orders, as well as the respective order status. The following states can be distinguished:
- Open -> The order has been sent to wbv*
- In progress -> order is available for picking
- Reserved -> The items have been reserved for the order, the order is not yet available for picking
- Partly delivered -> Only part of the order has been shipped
- Ready to ship -> The order is completed
Notice! Unlike other overviews, the default filter is set to the last 3 months.
*If this status is displayed for an order over a longer period of time, it may be the case that at least one item of the order is out of stock and the order cannot be processed.
 The upper part of the overview shows the master data of the orders, as well as the current status of each order. The graphic on the left shows how many orders still have to be processed.

In the overview below, the order status per day is indicated by colour. Usually orders from the past days should always have the status “ready for dispatch” (dark blue).

There is also an overview of how many parcels were sent to different destination countries.
2.9 Visualization and saving of data sources
The BI tool with its multiple functions also allows to download some data. This can be done using different file formats.
If you are in an overview, a double arrow symbol and three dots appear in some areas when you move the mouse pointer over the upper right corner, or you can right click in the area.
The double arrow symbol is used to expand the view of the area. The menu with the three dots offers in some cases the possibility to download data:

You can choose between an image file, a PDF file and an Excel file (data):

If you choose one of the three options, the file will be available for download:

The file can then be opened and the data used for further processing.